Getting started with Great Expectations
Welcome to Great Expectations! This tutorial will help you set up your first local deployment of Great Expectations that contains a small Expectation Suite to validate some sample data. We'll also introduce important concepts, with links to detailed material you can dig into later.
The steps described in this tutorial assume you are installing Great Expectations version 0.13.8 or above.
For a tutorial for older versions of Great Expectations, please see older versions of this documentation, which can be found here.
The tutorial will walk you through the following steps:
- First, we will introduce you to the data and help you initialize a Data Context.
- Then you will learn how to configure a Datasource to connect to your data.
- You will then create your first Expectation Suite using the built-in automated profiler.
- We'll also give you a tour of Data Docs to view your Validation Results.
- We will show you how to use this Expectation Suite to validate a new batch of data.
- Finally, in the optional section, you will learn how to customize your deployment.
The data problem we're solving in this tutorial
In this tutorial, we will be creating an Expectation Suite for this example data set that allows us to assert that we expect at least 1 passenger per taxi ride based on what we see in the January 2019 data (and based on what we expect about taxi rides!). We will then use that Expectation Suite to catch data quality issues in the February data set.
The NYC taxi data we’re going to use in this tutorial is an open data set which is updated every month. Each record in the data corresponds to one taxi ride and contains information such as the pick up and drop-off location, the payment amount, and the number of passengers, among others.
In this tutorial, we provide two CSV files, each with a 10,000 row sample of the Yellow Taxi Trip Records set:
yellow_tripdata_sample_2019-01.csv: a sample of the January 2019 taxi data
yellow_tripdata_sample_2019-02.csv: a sample of the February 2019 taxi data
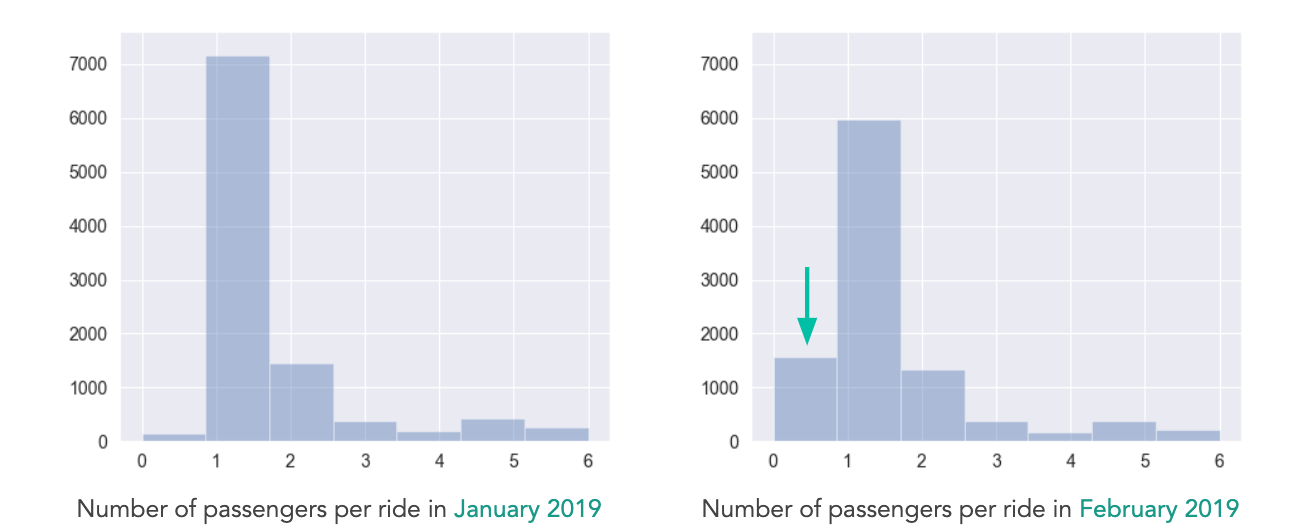
If we compare the passenger_count column in the January and February data, we find a significant difference: The February data contains a large proportion of rides with 0 passengers, which seems unexpected:
Click the "Next" button to get started with the tutorial!