How to add data visualization renderers for custom Expectations
This guide only applies to Great Expectations versions 0.13 and above, which make use of the new modular ExpectationA verifiable assertion about data. architecture. If you have implemented a Custom ExpectationAn extension of the `Expectation` class, developed outside of the Great Expectations library. but have not yet migrated it using the new modular patterns, you can still use this guide to implement custom RenderersA method for converting Expectations, Validation Results, etc. into Data Docs or other output such as email notifications or slack messages. for your Expectation.
This guide will help you add data visualization RenderersA method for converting Expectations, Validation Results, etc. into Data Docs or other output such as email notifications or slack messages. to a Custom ExpectationAn extension of the `Expectation` class, developed outside of the Great Expectations library..
Prerequisites: This how-to guide assumes you have:
- Completed the Getting Started Tutorial
- Have a working installation of Great Expectations
- Set up a working deployment of Great Expectations
- Configured a Data Context.
- Implemented a Custom Expectation.
- Set up a Data Docs site.
- Configured an Expectations Suite containing your Custom Expectation.
- Have installed and are familiarized with Altair
See also this complete custom expectation with renderer example.
Steps
1. Input
Enter the following in a Jupyter Notebook:
example_expectation_config = ExpectationConfiguration(**{
    "expectation_type": "expect_column_kl_divergence_to_be_less_than",
    "kwargs": {
        "column": "BATHRM",
        "partition_object": {
            "values": [0.0, 1.0, 2.0, 3.0, 4.0, 5.0, 6.0, 7.0, 8.0, 9.0, 10.0, 11.0, 12.0, 13.0, 14.0, 24.0],
            "weights": [
                0.000429396884072176,
                0.37112959384655597,
                0.34935170405219973,
                0.18408057725876764,
                0.07543383087363596,
                0.01257386093141785,
                0.004658022720695996,
                0.0012135129332474538,
                0.0006627647558505326,
                0.000214698442036088,
                0.00013068600819587966,
                6.534300409793983e-05,
                2.8004144613402784e-05,
                9.33471487113426e-06,
                9.33471487113426e-06,
                9.33471487113426e-06
            ]
        },
        "threshold": 0.6,
        "result_format": "COMPLETE"
    }
})
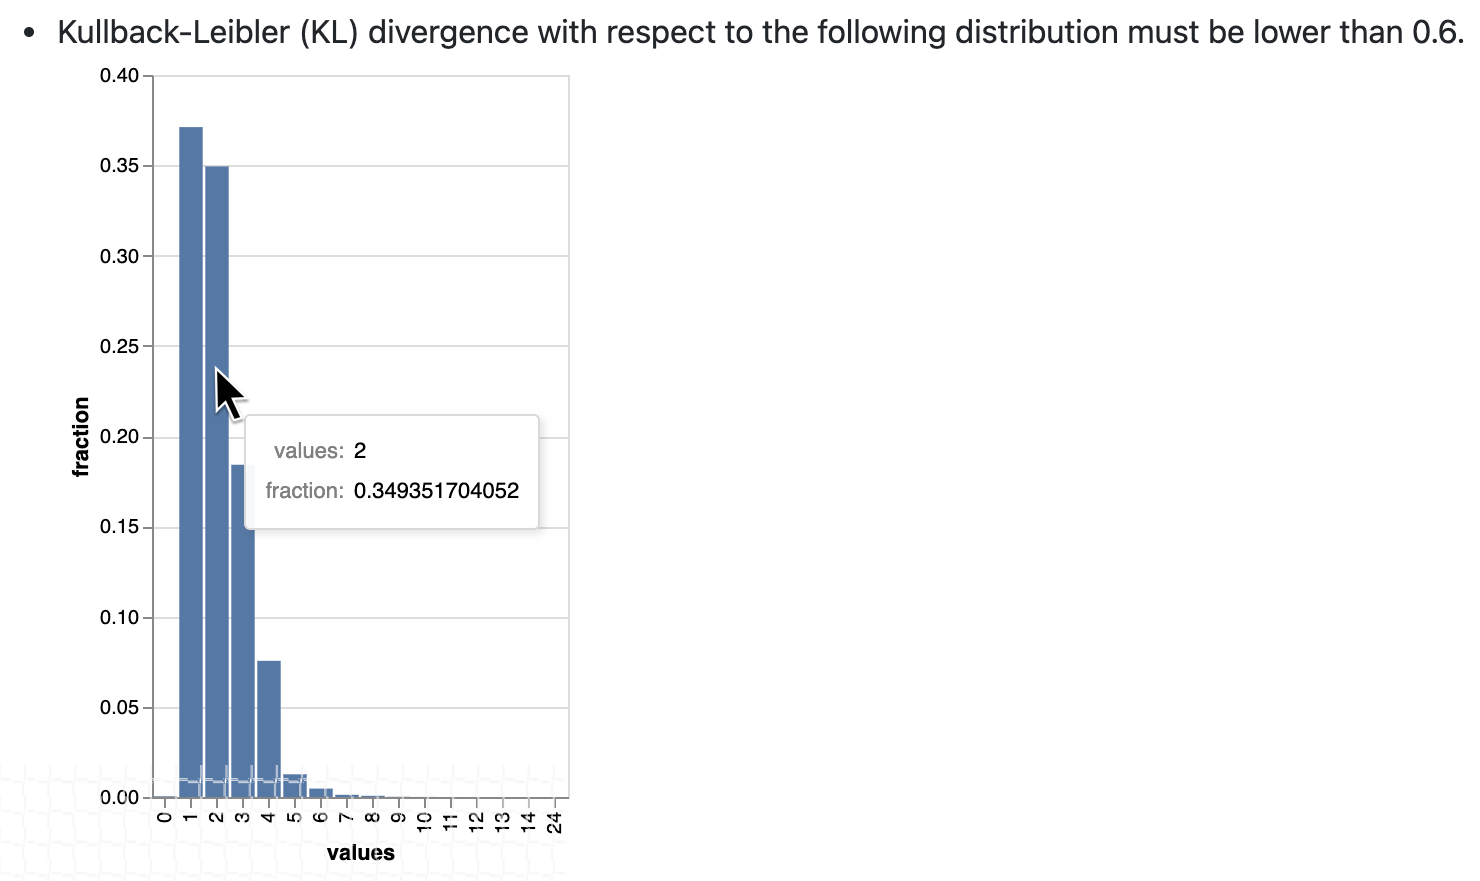
2. Rendered Output
3. Implementation
import altair as alt

class ExpectColumnKlDivergenceToBeLessThan(TableExpectation):
    ...

    @classmethod
    @renderer(renderer_type="renderer.prescriptive")
    @render_evaluation_parameter_string
    def _prescriptive_renderer(
        cls,
        configuration=None,
        result=None,
        language=None,
        runtime_configuration=None,
        **kwargs
    ):
        runtime_configuration = runtime_configuration or {}
        include_column_name = runtime_configuration.get("include_column_name", True)
        include_column_name = (
            include_column_name if include_column_name is not None else True
        )
            styling = runtime_configuration.get("styling")
            # get params dict with all expected kwargs
            params = substitute_none_for_missing(
              configuration.kwargs,
                [
                    "column",
                    "partition_object",
                    "threshold",
                    "row_condition",
                    "condition_parser",
                ],
            )

            expected_distribution = None
            if not params.get("partition_object"):
                template_str = "can match any distribution."
            else:
                template_str = (
                    "Kullback-Leibler (KL) divergence with respect to the following distribution must be "
                    "lower than $threshold."
                )
                # use utility method to generate kl divergence graph
                expected_distribution = cls._get_kl_divergence_graph(
                    params.get("partition_object")
                )

            if include_column_name:
                template_str = "$column " + template_str

            if params["row_condition"] is not None:
                (
                    conditional_template_str,
                    conditional_params,
                ) = parse_row_condition_string_pandas_engine(params["row_condition"])
                template_str = conditional_template_str + ", then " + template_str
                params.update(conditional_params)

            expectation_string_obj = {
                "content_block_type": "string_template",
                "string_template": {"template": template_str, "params": params},
            }

            if expected_distribution:
                return [expectation_string_obj, expected_distribution]
            else:
                return [expectation_string_obj]

        @classmethod
        def _get_kl_divergence_graph(cls, partition_object, header=None):
            weights = partition_object["weights"]

            # determine and set proper graph width
            graph_pixel_width = (len(weights) / 60.0) * 500
            if graph_pixel_width < 250:
                graph_pixel_width = 250
            graph_container_col_width = round((len(weights) / 60.0) * 6)
            if graph_container_col_width < 4:
                graph_container_col_width = 4
            elif graph_container_col_width >= 5:
                graph_container_col_width = 6
            elif graph_container_col_width >= 4:
                graph_container_col_width = 5

            # if single bar, set size
            mark_bar_args = {}
            if len(weights) == 1:
                mark_bar_args["size"] = 20

            # generate graph for continuous distribution
            if partition_object.get("bins"):
                bins = partition_object["bins"]
                bins_x1 = [round(value, 1) for value in bins[:-1]]
                bins_x2 = [round(value, 1) for value in bins[1:]]

                df = pd.DataFrame(
                    {"bin_min": bins_x1, "bin_max": bins_x2, "fraction": weights,}
                )

                bars = (
                    alt.Chart(df)
                    .mark_bar()
                    .encode(
                        x="bin_min:O",
                        x2="bin_max:O",
                        y="fraction:Q",
                        tooltip=["bin_min", "bin_max", "fraction"],
                    )
                    .properties(width=graph_pixel_width, height=400, autosize="fit")
                )

                graph = bars.to_json()
            # generate graph for categorical distribution
            elif partition_object.get("values"):
                values = partition_object["values"]

                df = pd.DataFrame({"values": values, "fraction": weights})

                bars = (
                    alt.Chart(df)
                    .mark_bar()
                    .encode(
                        x="values:N", y="fraction:Q", tooltip=["values", "fraction"]
                    )
                    .properties(width=graph_pixel_width, height=400, autosize="fit")
                )
                graph = bars.to_json()

            # generate header if present
            if header:
                expected_distribution = RenderedGraphContent(
                    **{
                        "content_block_type": "graph",
                        "graph": graph,
                        "header": header,
                        "styling": {
                            "classes": [
                                "col-" + str(graph_container_col_width),
                                "mt-2",
                                "pl-1",
                                "pr-1",
                            ],
                            "parent": {"styles": {"list-style-type": "none"}},
                        },
                    }
                )
            else:
                expected_distribution = RenderedGraphContent(
                    **{
                        "content_block_type": "graph",
                        "graph": graph,
                        "styling": {
                            "classes": [
                                "col-" + str(graph_container_col_width),
                                "mt-2",
                                "pl-1",
                                "pr-1",
                            ],
                            "parent": {"styles": {"list-style-type": "none"}},
                        },
                    }
                )
            return expected_distribution
4. Test Renderers
Finally, test that your renderers are providing the desired output by building your Data DocsHuman readable documentation generated from Great Expectations metadata detailing Expectations, Validation Results, etc. site:
Use the following CLICommand Line Interface command: great_expectations docs build.